Next: Color window
Up: User interface - features
Previous: User interface - features
Contents
Figure:
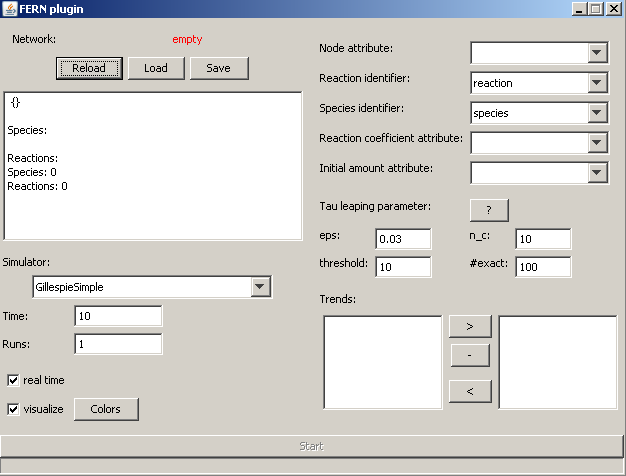
Cytoscape plugin main window
|
|
In figure ![[*]](crossref.png) the main window of the cytoscape plugin is shown. It is composed of several elements (from top to bottom and left to right):
the main window of the cytoscape plugin is shown. It is composed of several elements (from top to bottom and left to right):
- Network: Indicates wheter the actual loaded network can be used for simulation (if not, some error message is displayed in the textbox).
- Reload: Try to load the network actually displayed in cytoscape into the plugin.
- Load; Load a fernml network from the filesystem.
- Save: Save the actual loaded network as fernml file.
- Simulator: Choose one of the built-in simulation algorithms. For more information refer to the fern documentation or to [2,3,4,5,6].
- Time: Define the timespan to simulate (depends on your reaction network).
- Runs: If you want to automatically repeat the simulation, you can specify here the number of repeats (a non positive value leads to infite repeats).
- real time: If you check this, the algorithm will pause between to reaction firings the simulated amount of time. This means that the simulation will take at least as much time as you defined in time and it would take exactly the time you defined if your computer was infinetly fast (and hence can run the algorithm and draw the network without any extra time).
- visualize: If you check this, the simulation progress is shown directly in the cytoscape main window. Each firing of a reaction is indicated by a blinking of the corresponding reaction node and the amounts of each molecular species is indicated by coloring the corresponding species node.
- Attributes: As mentioned above, the network must fulfill some requirements by setting some attributes. The names of these attributes have to be specified here.
- Tau leaping parameters: For the three tau leaping algorithms you can specify some parameters controlling the behaviour / performance (for more information refer to [6]:
- eps: error bounding
 : threshold for critical reactions
- threshold: for temporarily abandoning tau leaping
- #exact: how many exact SSA steps when abandoning tau leaping
- Trends: In the left listbox the names of each molecular species of the loaded network is shown. You can move them to the right box (and of course back) by selecting them and clicking the appropriate button. For each species in the left box a trend will be created when you simulate the network. If you want several plots, you can separate species by using the - button.
Next: Color window
Up: User interface - features
Previous: User interface - features
Contents
Florian Erhard
2007-06-20